
The expanded analysis of the January 5 balloon flight to the edge of space is finally available! If you aren't a geek, you will be probably be satisfied with the YouTube documentary and photo albums that are presented below. But if you have been asking questions like, "How high did it go?", or "How come the camera didn't get too cold and stop working?", then you should keep reading after the fun multimedia shows.
If you enjoyed the movie and want to browse through the photos at your own pace, be sure to check out this annotated photo album.
Now it's time to get down to geek business...
The number one question I have been asked has been, "How high did the balloon go?" In order to answer this question, we flew my Garmin Vista Cx that logged GPS location every 5 seconds and also logged barometric pressure/altitude. I configured the GPS to use the pressure in the altitude calculation, since I had heard rumors of consumer GPS not working at high altitudes. However, upon recovery we were disappointed to discover that the barometric pressure saturated at 300 mBar (30k feet) and the cadence was very slow (~15 mins/sample).
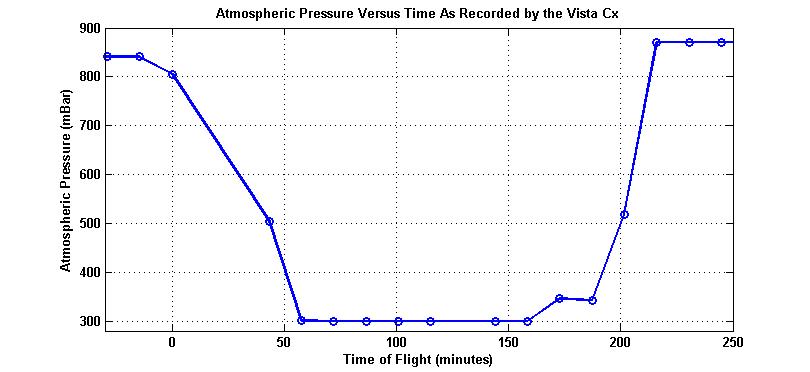
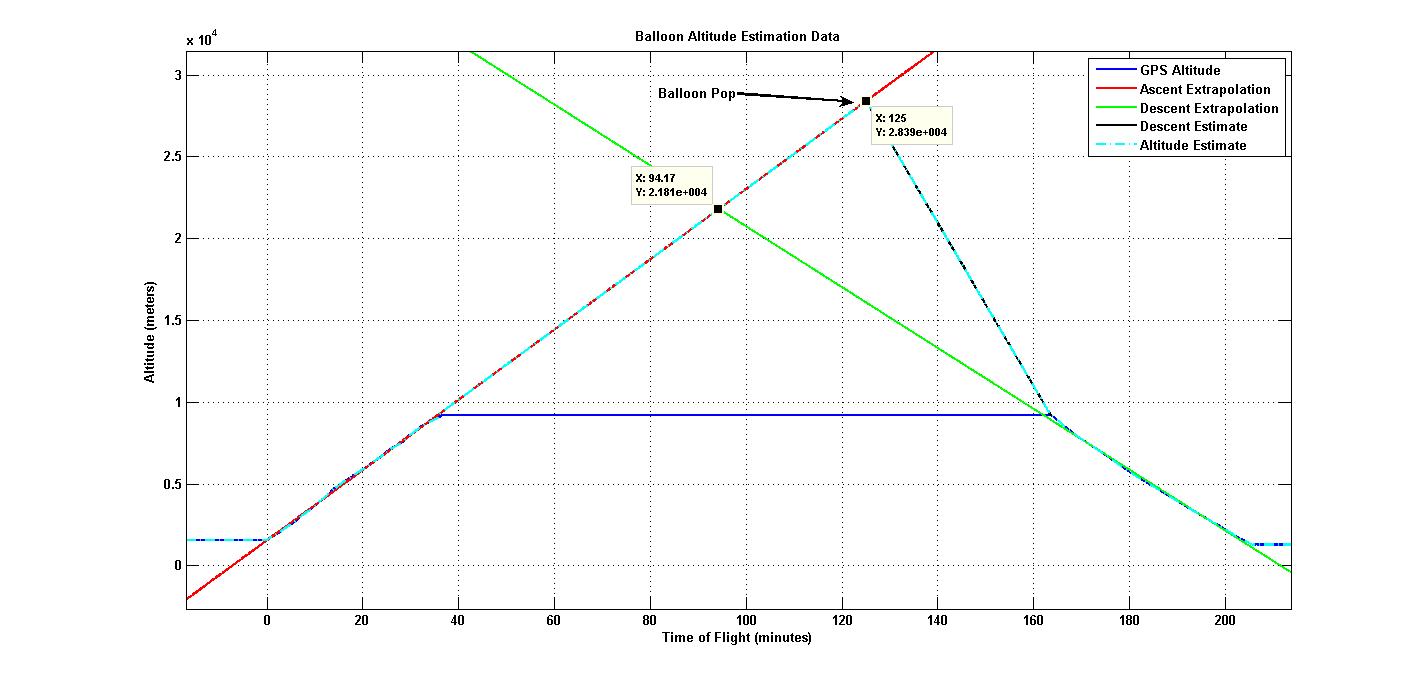
The saturated pressure resulted in a GPS profile that maxxed out at 30,000 feet. However, the rise rate up to that elevation and the descent rate had great fidelity, so there was hope at estimating the maximum altitude. Finally, the photos were taken at regular 1-minute intervals, and the images showed clearly when the balloon popped, since they began to tumble irregularly. So with a little engineering detective work, I was able to estimate the maximum altitude at 93,687 feet as seen in the plot below!
Another interesting lesson we learned regarding altitude was that the SPOT does not provide altitude in its location reports. Because of that, when we received updates near the predicting landing site at Limon, we assumed that it was on its way down. We spent several minutes looking up in the sky, only to learn much later that it was at its apex at that time!
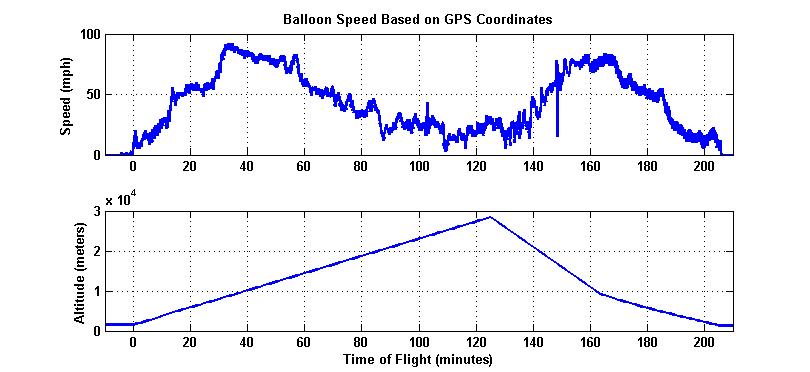
Garmin MapSource software was used to determine the speed of the balloon throughout its trajectory based on the time-tagged GPS locations. The plot below shows that the speed was at its maximum when it was traveling in the jet stream. However, the maximum speed was not properly reflected, since the vertical component during free-fall was not part of the GPS data.
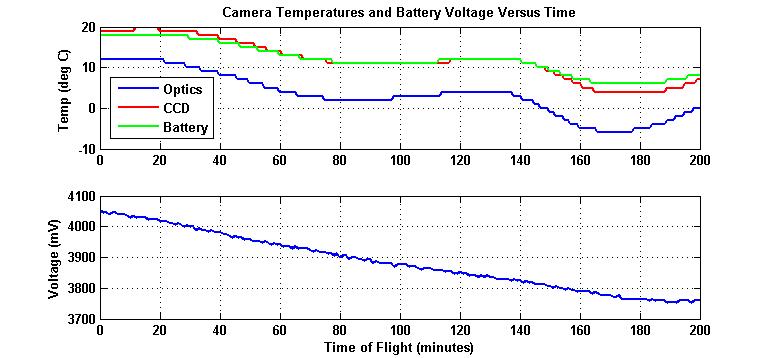
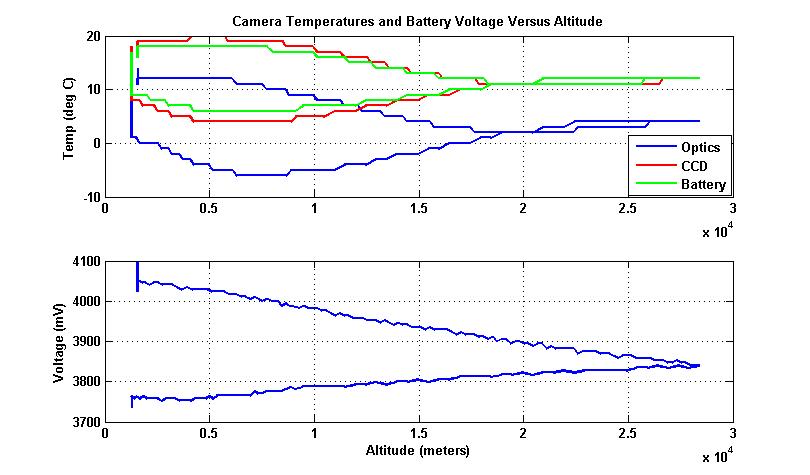
The other question that has been asked frequently has been, “How did the camera not freeze in the cold upper atmosphere?” First off, we packaged it in a styrofoam container that helped to maintain a warm environment, and secondly, Lars built a resistive heater using two 9volt batteries. But still, we didn’t know how things would turn out. However, Sam discovered that in CHDK, he could log temperatures in the camera, so that if it did stop working during the flight, we would know what conditions caused the problem. He was able to configure the SD800 to log the temperature of its optics, the CCD sensor, and the battery, as well as the battery voltage every minute when the photos were programmed to be taken. Additionally, he created a low-power mode (3.7volts) that would take photos less frequently. As previously said, the camera was still operating when we recovered it which was a testament to his programming and the camera itself! The plot below shows that the coldest portion of the camera was the optics housing, which wasn’t surprising, since it was exposed to the outside environment. We were pleasantly surprised to see that camera stayed relatively warm throughout the flight and that a heater may not even be needed if we need to save weight in the future. You can check out a plot of the temperature versus altitude here and try to explain to yourself the reason for the temperature at the apex of the flight.
All of this data is really fun, but questions kept coming up when looking at the photos. People would ask, “How high was it in this photo?”, or “How fast was it traveling in this photo?” Since I had the times of all the photos and time tagged data, I was able to correlate the two and ultimately insert the data into the description field of the IPTC header for each of the photos in this album.
 Finally, with the newly predicted altitude, I was able to modify the GPX files and incorporate the predicted profile into Google Earth. That profile was then used with RoboGeo to geotag the annotated photos to create an interactive experience in Google Earth that provides a comparison between the predicted path, the measured path, the extrapolated path, and the SPOT update locations. And to top it off, satellite cloud imagery was overlaid in order to show correlations between the camera photos and the satellite photos! (SpaceBalloon140.jpg, 215, 225, 232 shows the blob cloud with the same perspective as the weather satellite photo overlay.) You can get the KMZ file here.
 Or if you don’t want to view the photos in Google Earth, you can always check out this Google map in Picasa with geotagged photos instead.
You would think I was done with this data-rich, multi-media interpretation of the balloon launch, but I also decided to publish a Blurb book with the best photos from the album. After all, this website is all about digital stories, right? Click on the link below to preview or order the book.

I hope you’ve enjoyed this experience. I know I have and I look forward to more balloon launches in the future!


